Industrial IoT & Cloud Solutions
Connect your equipment. Capture your data. Understand what's happening.
Industrial IoT links sensors, instruments and equipment to computers so data can be collected, shared and analyzed. In practice, it means you can see what your equipment is doing without someone walking the floor to check. N3 IT Solutions designs these systems and has built proof-of-concept projects on AWS.
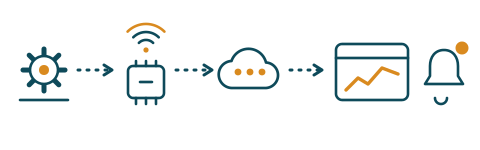
Example architecture
From equipment to a screen someone can act on. The exact design depends on your equipment, your network and your budget.
Equipment & sensors
Machines, meters and sensors produce readings.
IoT connectivity
Devices connect securely, directly or through a gateway.
Cloud data ingestion
Readings arrive in the cloud as they are produced.
Data processing
Data is cleaned, filtered and stored.
Analytics
Trends and unusual patterns are identified.
Dashboard & alerts
People see what matters and are notified.
One implementation on AWS
IoT sensor to AWS IoT Core, then Kinesis Data Firehose and Kinesis Data Analytics for real-time processing, AWS Lambda for custom logic and DynamoDB for storage. A data lake feeds business intelligence and analytics, and custom dashboards show streaming data.
Sensor & device connectivity
We work with the measurements that matter to your operation: temperature, humidity, energy, pressure, vibration, equipment status, runtime and other operational readings.
Every device is registered, given security keys and granted only the permissions it needs, so the connection is controlled from the start.
| Source | Path to the cloud |
|---|---|
| Mobile devices and vehicles | Telematics unit, then 3G/LTE, then the cloud |
| Low-power sensors | LoRaWAN, then a gateway, then the cloud |
| Industrial controllers (PLCs) | Wired OPC UA, then a gateway, then the cloud |
| Building controllers | LoRaWAN controller, then the cloud |
Cloud data ingestion
IoT data is generated by devices, grows quickly, arrives in many formats and is used by different people and applications. The ingestion design has to be affordable, efficient and fit the limits of distance, cost and regulation between the sensor and the cloud.
On AWS, we build with services such as AWS IoT Core, Kinesis, Lambda and DynamoDB, using APIs and event-driven architecture, so you pay for managed services instead of running servers.
How we keep it efficient
- Send data only when a value changes (delta encoding) to reduce messaging cost.
- Do basic ingestion up front, then process in batches when real-time isn't needed.
- Use event-driven processing when something must happen right away, or combine batch and event-driven.
- Store everything in a data lake for later analysis and business intelligence.
Monitoring & alerts
Once readings arrive, rules can watch them. When a value crosses a limit you set, or equipment stops reporting, the right person is notified by email or message, so a small issue doesn't wait until the next inspection.
Dashboards and web apps
Trends can be shown in tools such as Grafana, Kibana or Amazon QuickSight, or in a custom web application built with AWS AppSync, depending on who needs to see the data and how.
Analytics & anomaly detection
Historical readings show what normal looks like for a machine. Against that baseline, unusual patterns, such as a change in vibration, can be flagged for someone to look at.
Models can be built with industry-standard tools such as Keras and TensorFlow. Anomaly detection and forecasting can also be done with Amazon QuickSight.
Predictive maintenance
Predictive maintenance means using patterns in data such as vibration, temperature and runtime to spot equipment that may need attention sooner, so maintenance can be planned rather than reactive.
It depends on having enough good-quality data. If you don't yet, we'll tell you, and start by collecting it.
AI + IoT
IoT tells you what is happening.
AI can help determine what it means.
Have equipment that should be talking to the cloud?
Tell us what you monitor today, and what you wish you could see. We will explore what is practical.